2024 PPAI 100 Supplier Benchmarking: Business Practices Of The Industry Leaders

PPAI 100 is not only a guide for what the promotional products industry can look like, but also a resource for member companies to know where they stand compared to their highly performing peers.
As part of the 2024 PPAI 100 rollout, PPAI Research has gathered some supplier benchmarking data provided by companies that appear in this year’s ranking, available as reference for any interested industry members. Later, we will share benchmarks on the industry leaders’ innovation and responsibility practices.
Today we take a look at some key performance indicators of their businesses.
While the averages determined in these statistics were heavily influenced by the industry’s largest suppliers, it’s important to note that PPAI 100 isn’t just a ranking of the highest revenue companies. It considers eight distinct categories, meaning that small-to-mid-size companies are able to make the list, and in some cases, rank fairly high. In this way, the median of the KPI statistics is arguably more valuable.
Below is a breakdown of each benchmarking statistic, with insight and reaction from decision makers among the ranking suppliers.
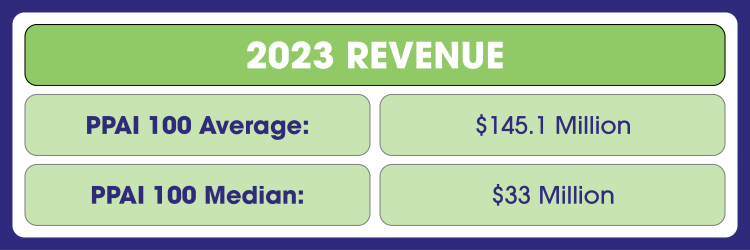
Compared to last year, the average and median revenue of PPAI 100 suppliers is down 44% and nearly 50%, respectively. Don’t fret, there’s a simple explanation: the PPAI 100 has doubled this year to 100 suppliers and 100 distributors. As a result, there are more companies on the list with less revenue than their larger counterparts.
For example, three out of the top five suppliers in the 2024 PPAI 100 each exceeded $2 billion in 2023 sales – with SanMar at No. 1 at an estimated $3.9 billion – but no other supplier topped even $800 million.
“This is great information that correlates with not only what our company is experiencing, but also what we see and hear during meetings and shows,” says Scott McFadden, CFO at Bag Makers – ranked the No. 29 supplier in the 2024 PPAI 100.
At the same time, even though the industry’s revenue topped $26 billion last year, the milestone actually represents a net negative. Promo’s growth rate for 2023 was 2.24%, failing to outpace inflation, which has not dipped below 3% since March 2021 according to the Consumer Price Index report.
“Promo’s revenue totals in 2023 show that the industry is healthy, but growth has tapered off since 2022’s explosive returns,” says Alok Bhat, market economist and research lead at PPAI. Promo’s growth rate in 2023 is a significant step back from 2022’s growth rate of 15.6% and 2021’s growth rate of 12.5%.
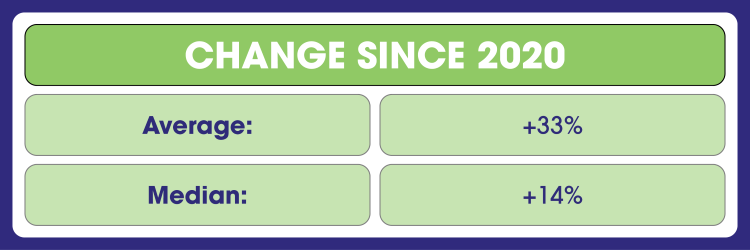
No surprise that revenue has increased since 2020, which was an outlier year due to the effects of the COVID-19 pandemic on the market.
“The PPAI 100 Supplier Benchmarking report tells the story of the industry, generally, returning to pre-pandemic levels,” says Chris Anderson, CEO of HPG – ranked the No. 6 supplier in the 2024 PPAI 100.
“However, upon closer examination, it becomes clear that the larger suppliers and those who are investing in technology, in their employees, in meaningful sustainability initiatives and in new product development and capital investments are outpacing the market, generally. Distributors are voting with their dollars and, increasingly, they’re directing that spend to the suppliers that are investing in the future of the industry.”
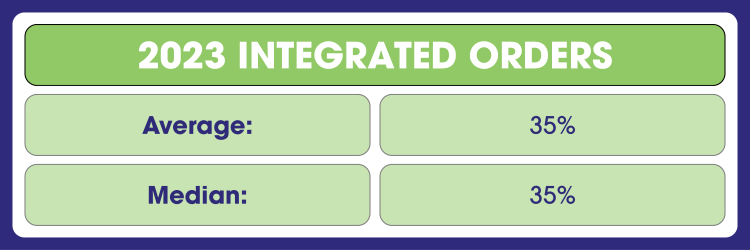
For these purposes, PPAI is defining integrated orders as “an order in which 35% or more of the data is machine read and the data is available in a company’s ERP/order system without human intervention whether that is OCR, EDI, API or other electronic means that likely reduces errors when receiving orders from customers.”
While the average amount of integrated orders has increased from 32.7% last year, the median has climbed 10%.
“We’ve had more than 90% of our orders integrated for a number of years using an ERP add-on at first and then programming our own integration tool,” McFadden says. “This high percentage has helped with maintaining efficiencies in order processing and minimizing the cost of initial order entry to our system.”
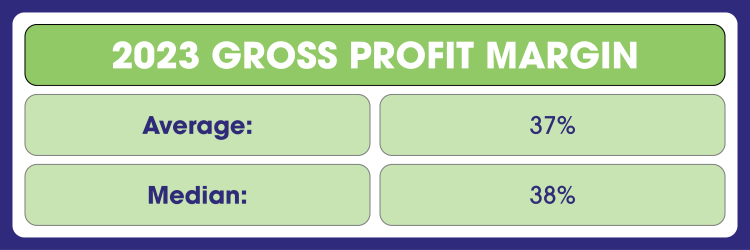
The average and median gross profit margin each inched up by 2% from last year.
“The gross profit margin percentages increasing baffles me as high-volume commodity lines normally work off lower margins,” says Peter Hirsch, president of Houston-based HIRSCH – ranked the No. 20 supplier in the 2024 PPAI 100.
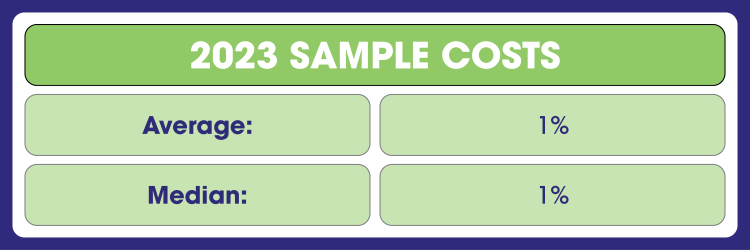
The average and median sample cost percentages have held steady since last year, indicating efficient processes in giving clients and distributors a sense of what they are purchasing. Sure, creating and shipping samples are a necessary part of doing business, but at least they’re a relatively low cost in the grand scheme of things.
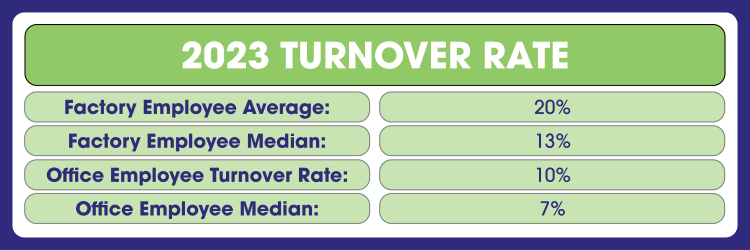
While the average and median factory employee turnover rates went down by 1% from last year, the average and median office employee turnover rates increased by 1% and 2%, respectively.
Of course, employees remain with these companies because they’re the industry’s best suppliers and the companies have been rated as the industry’s best suppliers because they’ve managed to keep great employees.
“PCNA’s investment in training and compensation enables us to retain experienced and talented decorators,” says Neil Ringel, CEO at PCNA – ranked the No. 3 supplier in the 2024 PPAI 100. “Our commitment to workforce development has helped ensure consistently high levels of quality and service.”
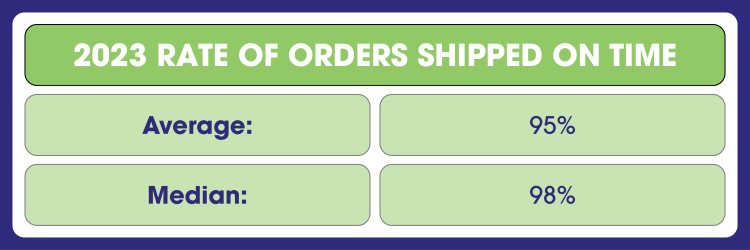
The average rate of orders shipped on time has decreased 2% since last year, which is probably because of the 50 additional companies added to this year’s PPAI 100.
With Bag Makers consistently having a more than 98% on-time shipping rate, McFadden says it’s been a great statistic and talking point when meeting with customers and prospects. “This stat gives our customers peace of mind knowing their orders will arrive on time or even early for their events and promotions,” he says.

