2024 PPAI 100 Distributor Benchmarking: Business Practices Of Industry Leaders

Since its debut in 2023, PPAI 100 has always been more than a ranking. It is a holistic approach to tracking a healthy industry. As a result, it is a resource for businesses to see what goes into a balanced distributor or supplier and learn from no matter their placement.
The PPAI 100 ranking process reveals valuable data and insightful patterns. As part of the 2024 PPAI 100 rollout, PPAI Research has gathered distributor benchmarking data provided by companies that appear in this year’s ranking as reference for any interested industry members. Later, we will share benchmarks on the industry leaders’ innovation and responsibility practices.
Today we take a look at some key performance indicators of PPAI 100 distributors’ businesses.
While the averages determined in these statistics were heavily influenced by the industry’s largest distributors, it’s important to note that PPAI 100 isn’t just a ranking of the highest revenue companies. It considers eight distinct categories, meaning that small-to-mid-size companies are able to make the list, and in some cases, rank fairly high. In this way, the median of the KPI statistics is arguably more valuable.
Below is a breakdown of each benchmarking statistic, with insight and reaction from decision makers among the ranking suppliers.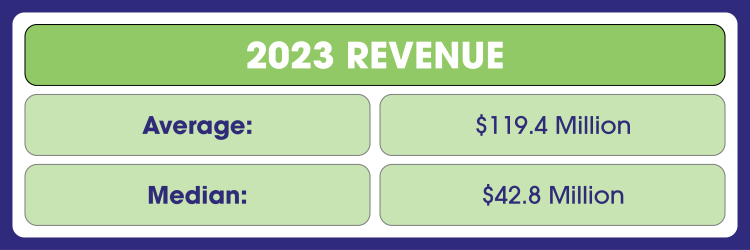
It was technically a record-breaking year for promo revenue with the industry topping $26 billion for the first time ever. It was a muted celebration, however, as that growth was outpaced by inflation, which has not dipped below 3% since March 2021 according to the Consumer Price Index report.
For this year’s PPAI 100, the average and median revenue numbers are also lower last year due to expansion of the list, which led to more companies on the list with less revenue than their larger counterparts.
Average revenue was brought up by the performance of the largest distributors on the list as 4imprint, which repeated as the No. 1 distributor, once again surpassed a billion dollars in revenue. Each of the top 15 distributors earned at least $150 million in revenue in 2023.
The average and median are both large numbers considering it represents the revenue of 100 distributors, but many promo leaders see 2024 as an important year with growth tapering off in 2023.
“Promo’s revenue totals in 2023 show that the industry is healthy, but growth has tapered off since 2022’s explosive returns,” says Alok Bhat, market economist and research lead at PPAI.
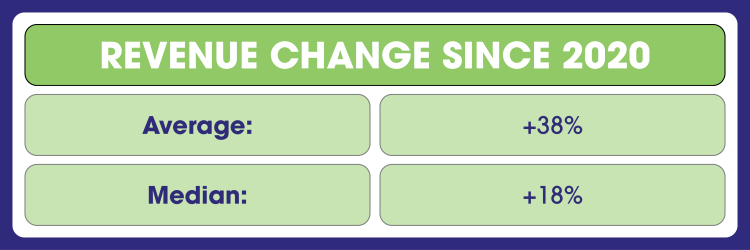
Speaking of growth, in order to avoid being overly influenced by outlier years, PPAI 100 measures growth over a three-year period. Using that metric, distributors fared slightly better in both average and median growth over a tumultuous and unpredictable three years.
“I know that business leaders have been concerned about companies pulling back spending, thinking there was a recession around the corner,” says Amy Spychalla, VP of strategic operations support at American Solutions for Business, which ranked No. 10 and grew by 26.3% over the last three years. “In the past, marketing was the first area to cut.”
That concern has consistently seemed like it was on the precipice of becoming a reality over the past three years, but the effectiveness of promo and the efforts of promo companies has proven to provide a healthy bounce back from the obstacles of 2020.
Still, Jake Himelstein, president of BAMKO, the No. 6 distributor, which saw 69% growth, speculates that these numbers might suggest some imbalance among distributors.
“I’m surprised to see the mean growth rate so much higher than the median,” says Himelstein. “I suppose this means that there are a few distributors who have outsized growth which is skewing the mean higher.”
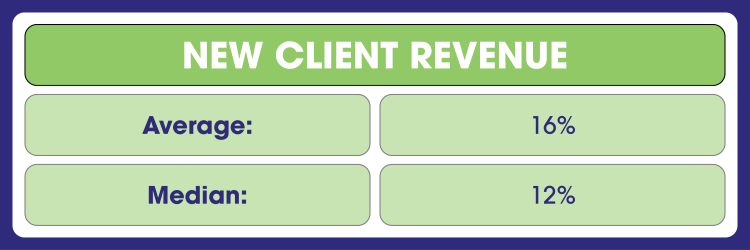
Double-digit percentages for average and median revenue from new clients suggests a promising outlook for promo according to Spychalla.
“It's wonderful to see that organizations believe in promoting their brand and achieving their goals through the power of promotional products,” Spychalla says. “That says a lot about this amazing industry we’re in and what it could mean for potential growth and stability ahead.”
Still, new client revenue is a key factor in revenue growth, and Andrew Titus, president of Fully Promoted, which ranked as the No. 26 distributor, expected to see higher numbers coming from new clients.
“I was surprised that these percentages were not higher given that the average growth of industry-wide revenue is significantly higher,” Titus says.
It is important to note, however, that the average growth numbers are measured over a three-year period and the new client percentages are measured over 2023, which was a slowed down growth year for the industry. According to Titus, new clients were a big part of business for Fully Promoted last year.
“At Fully Promoted, we have been seeing new client growth and those new clients placing larger orders with us,” Titus says. “We believe this is because of our differentiators as a franchise system where our local owner-operators are very hands-on in their business and can provide a high-touch customer experience that many of our clients seek us out for.”
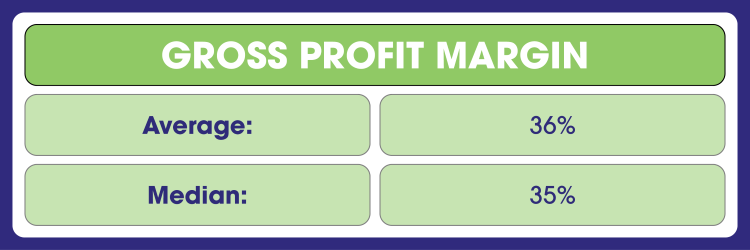
Gross Profit margins are crucial numbers for any business, and distributors reaching within the PPAI 100 healthily averaging over 30% is a positive sign.
“It’s good to see gross margins holding strong,” Himelstein says. “What we do is inherently difficult, and we (industrywide) should be compensated for the work we perform.”
Titus sees these numbers as an indicator of product trends in the promo market.
“These percentages tell me that our industry is heavily into hard good versus soft goods,” Titus says. “Items like bags and pens are popular hard goods for us, and we see a huge opportunity to grow that piece of our business as demand for hard goods holds strong. We are seeing gross profit steadily climb as our locations diversify their product mix and believe this will be an ongoing trend for us at Fully Promoted in the years to come.
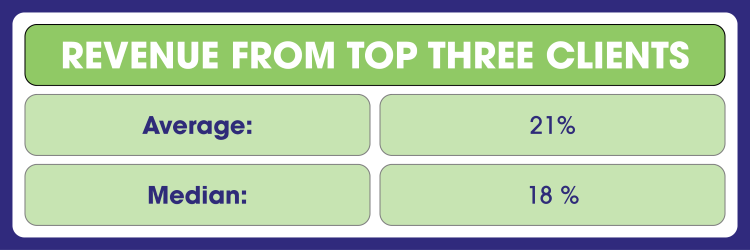
This number is bound to vary from distributor to distributor.
On one hand, a significant percentage of revenue coming from a few clients is understandable considering how heavily distributors rely on the good relationships they work hard to form in which loyal clients reward that experience. This statistic and the new client percentage outlined above will always have a causal relationship, as new clients represent diversification.
Still, relying too much on particular companies poses an inherent risk to the industry, as it leaves large swaths of revenue to factors outside of the control of distributors and suppliers. Getting those percentages a bit lower would leave promo companies less vulnerable should they lose a large account for any reason.
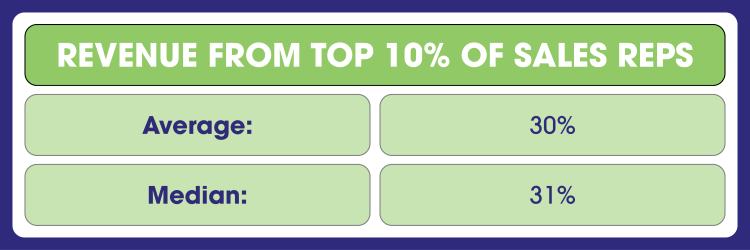
This number can similarly fluctuate for different distributors and might skew lower for larger companies – which would explain why the percentage are bit higher than last year when the list only included 50 distributors.
It is a percentage that reflects a delicate balance. It is important to take care of top earners, but training and mentoring sales reps to create more balance is equally important, as any sales rep may have their own reasons for leaving a job based on retirement or personal circumstances.
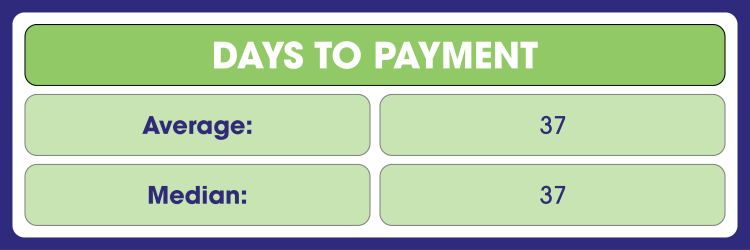
These numbers being the same for average and median suggests that large companies and smaller ones are operating on the same plane in terms of how long it takes to receive payment. It is also promising that these numbers are down from last year’s benchmarking in which the average was 43 days, and the median was 45.
Strong partnerships with customers create trust and doing research before partnering with certain clients can have a large impact on this statistic. It’s also important for many distributors to consider controlled or responsible growth in order to be able to handle the processes in which payments can be made accurately and quickly.
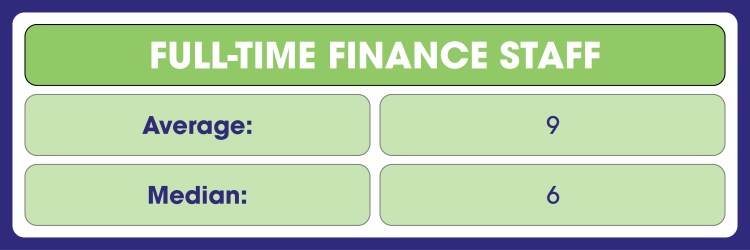
This is a figure obviously impacted by financial resources, but it can be a helpful point of reference to know where other companies stand in this regard. The median number of six full-time finance employees is only one less than last year’s despite adding 50 distributors – many of them smaller – to the list.
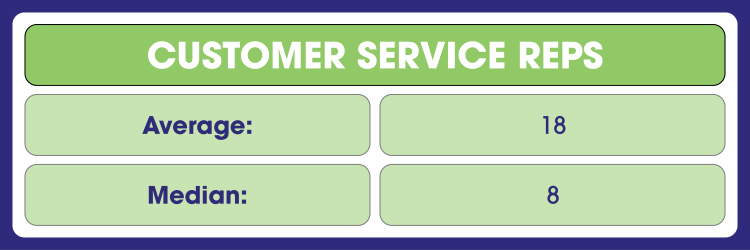
We are seeing a drastic difference in this regard compared to last year as a result of expanding the list from 50 distributors to 100. Last year’s average customer service rep stood at 74 and the median was 25.
This suggests that the largest companies are able to combat or eliminate issues by having a well-sized team of employees who can address problems in the moment. But the fact that many companies are operating at a level worthy of PPAI 100 with access to far fewer customer service reps could be the product of savvy investments in technology and online orders that eliminate friction in the order process.

